

The Analytics page in the Admin panel helps you track how the recordings in your workspace are performing based on views and visits. It gives you an overview of your most-watched videos and engagement across all your recordings. Each recording also has its own Analytics tab, explained further below.
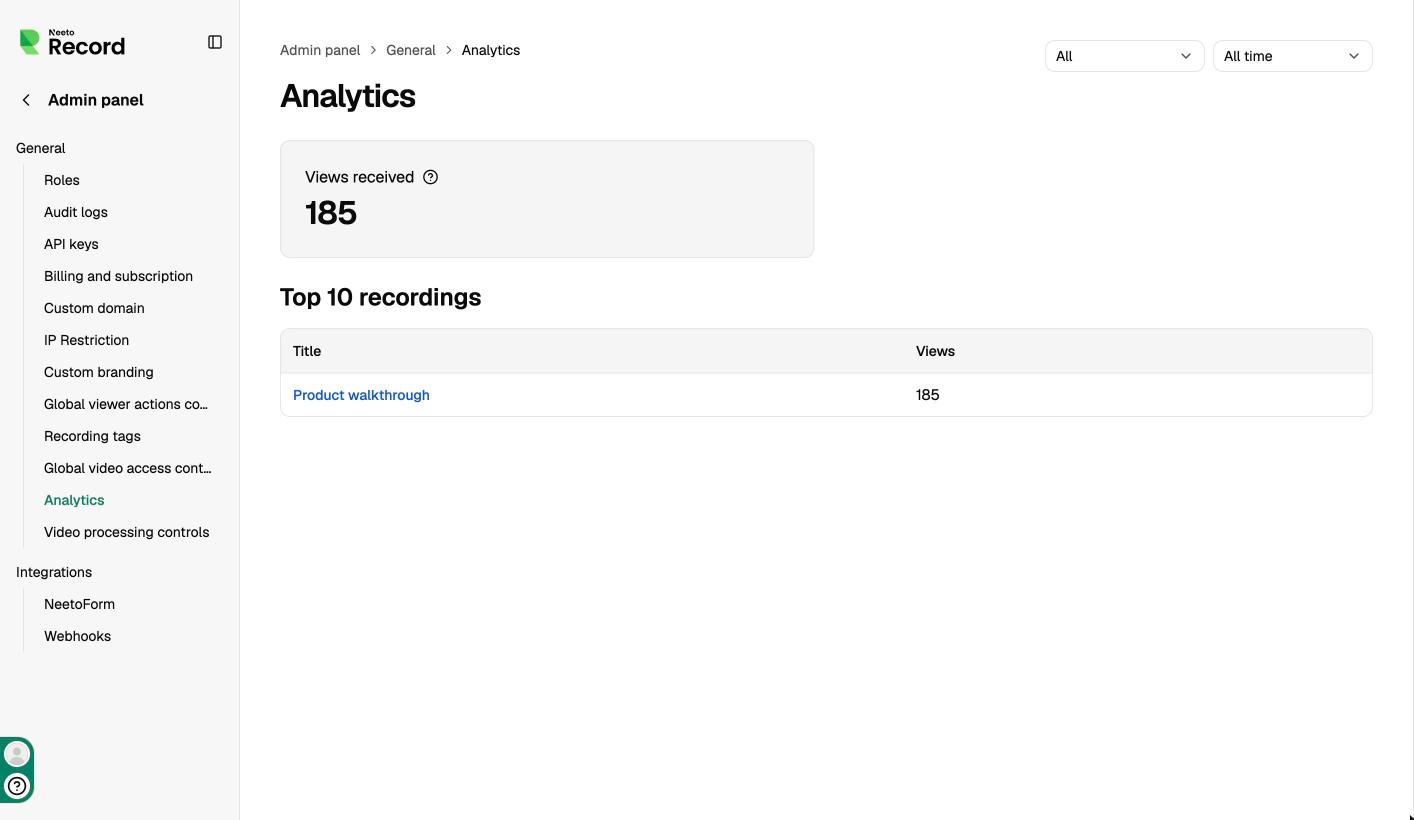
Top 10 recordings
The Top 10 recordings list shows your recordings in descending order of views. This helps you quickly identify which recordings have received the most attention.
Views received
The Views received card shows the total number of views across all your recordings. This includes every video you have recorded, not just the top 10.
Filtering analytics
Use the dropdown at the top to filter analytics by how your videos were watched:
All: Shows analytics for every video in your workspace.
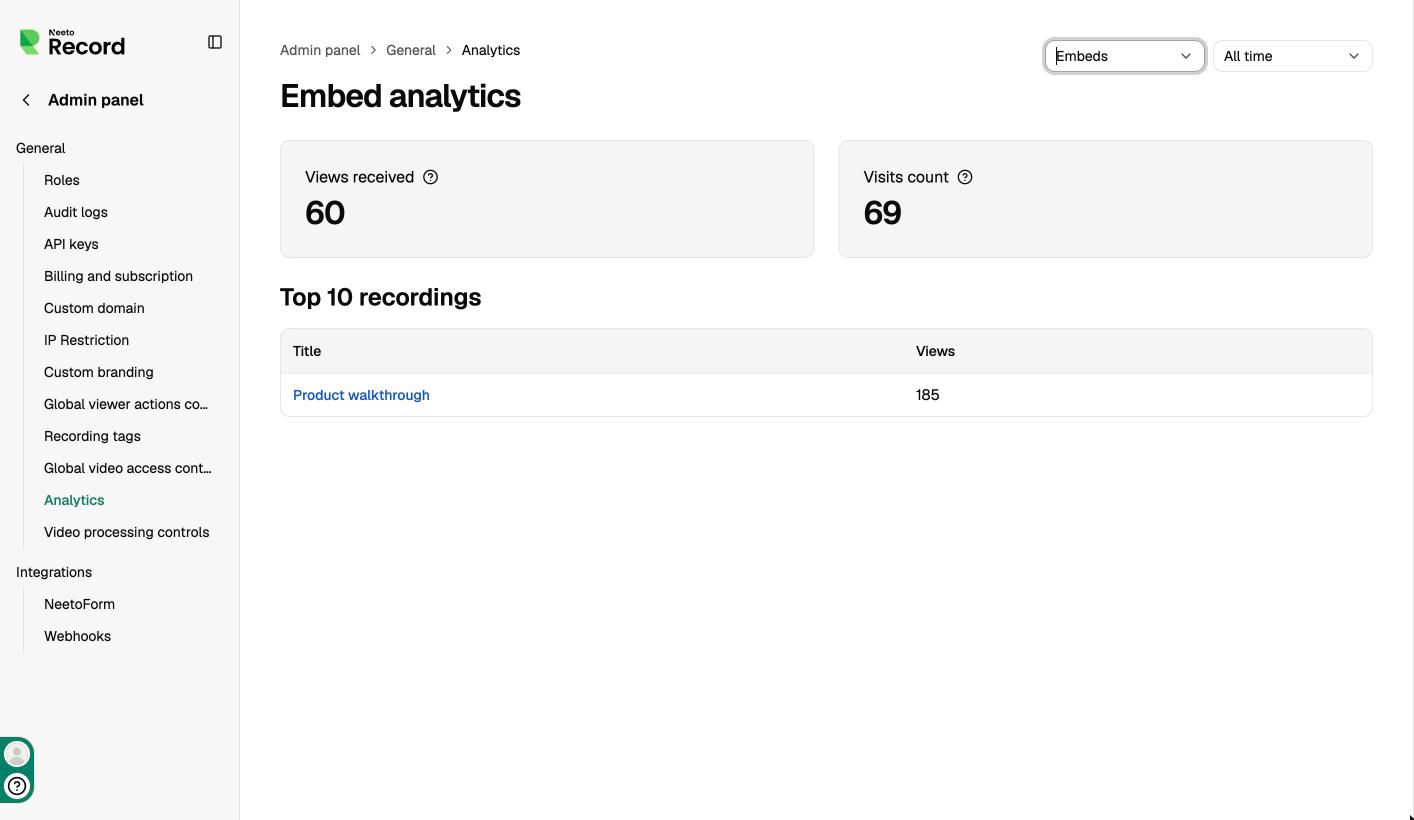
Embeds: Shows analytics only for videos watched where they are embedded on other websites.
When you select Embeds, the page title changes to Embed analytics, Views received counts only views of embedded videos, and the Top 10 recordings list only includes recordings that have been watched in an embed.
Visits count
When you select Embeds, an additional card named Visits count appears. This represents the number of times the host page containing the embedded video was visited, regardless of whether the video was played.
Analytics for a single recording
To see how one video is being watched, open the recording and go to its Analytics tab. Use the date filter at the top to choose a period. The tab has two views: Dashboard and Audience.
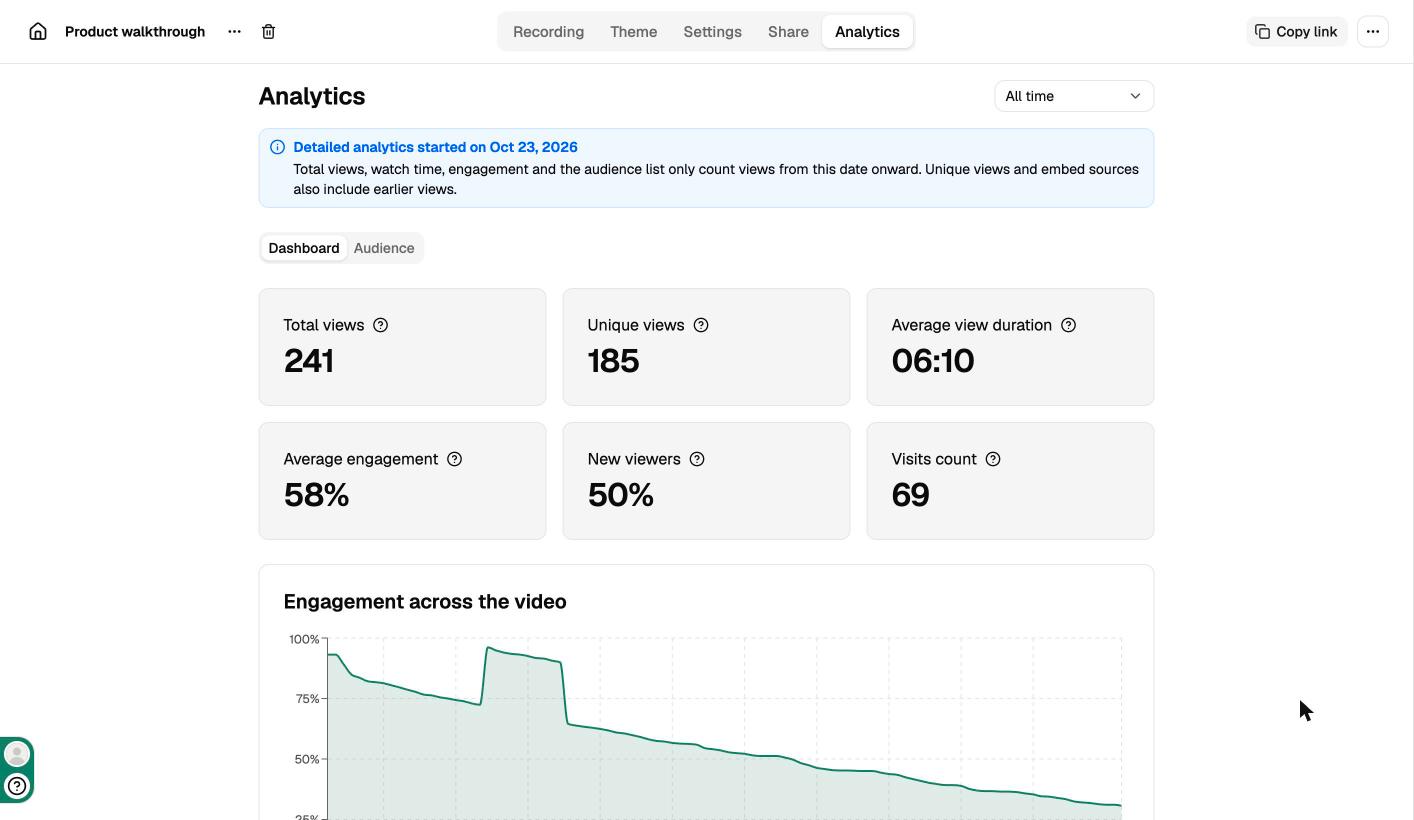
Dashboard metrics
Total views: Every playback session, including repeat views by the same viewer. A view starts when someone presses play. If the viewer is inactive for 30 minutes, their next play counts as a new view. Plays by the recording's owner are not counted.
Unique views: Views counted once per viewer every two days. This matches the view count shown under the video.
Average view duration: The average time watched per view.
Average engagement: How much of the video an average view watched. Muted playback counts as half.
New viewers: The share of signed-in viewers who watched a video from your workspace for the first time.
Visits count: The number of times pages with this video embedded were visited, whether or not the video was played.
Engagement across the video
This chart shows how much each part of the video was watched, as a percentage of views. A dip shows where viewers stopped watching or skipped ahead. A peak shows a part that viewers rewatched, and it can go above 100%.
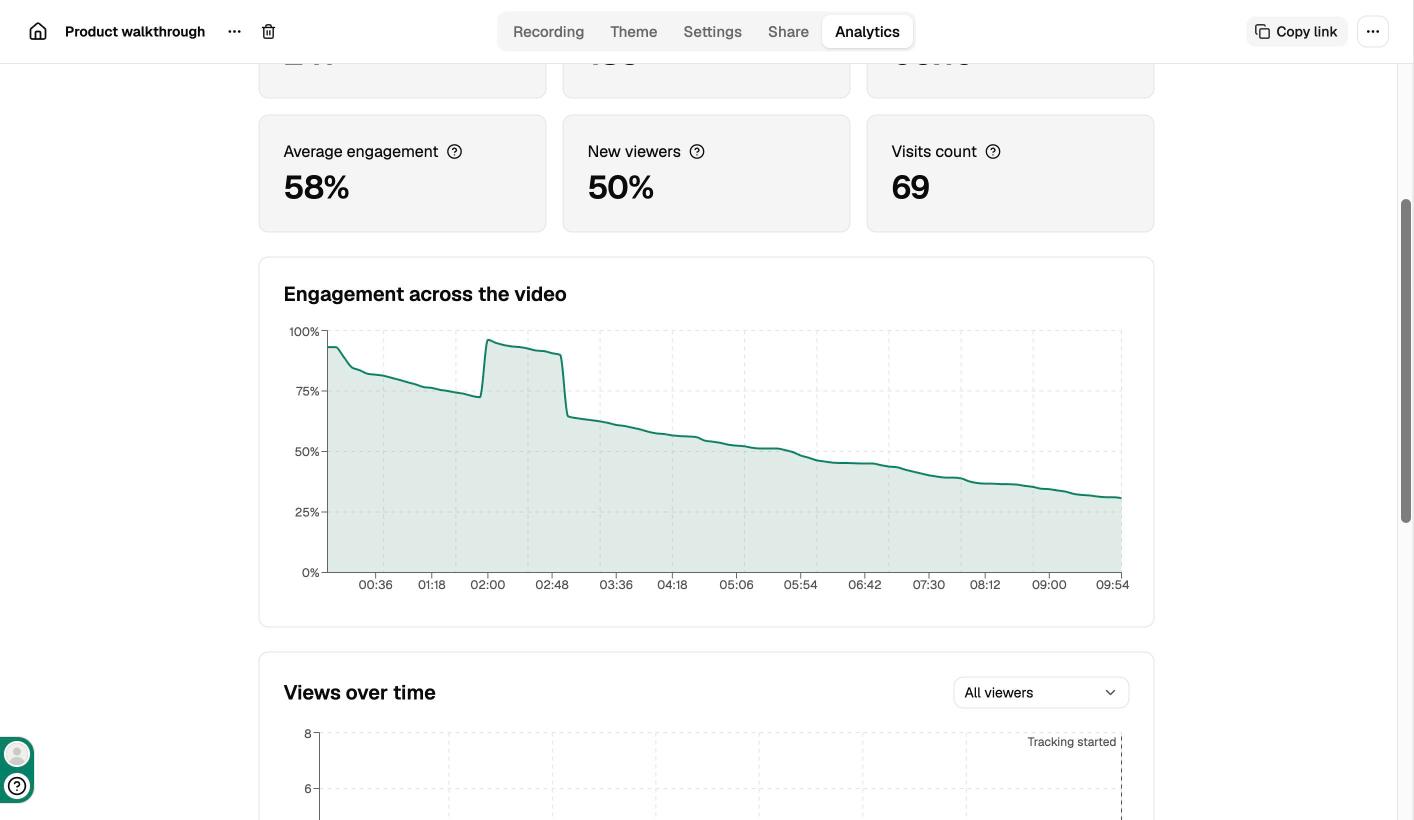
Views over time
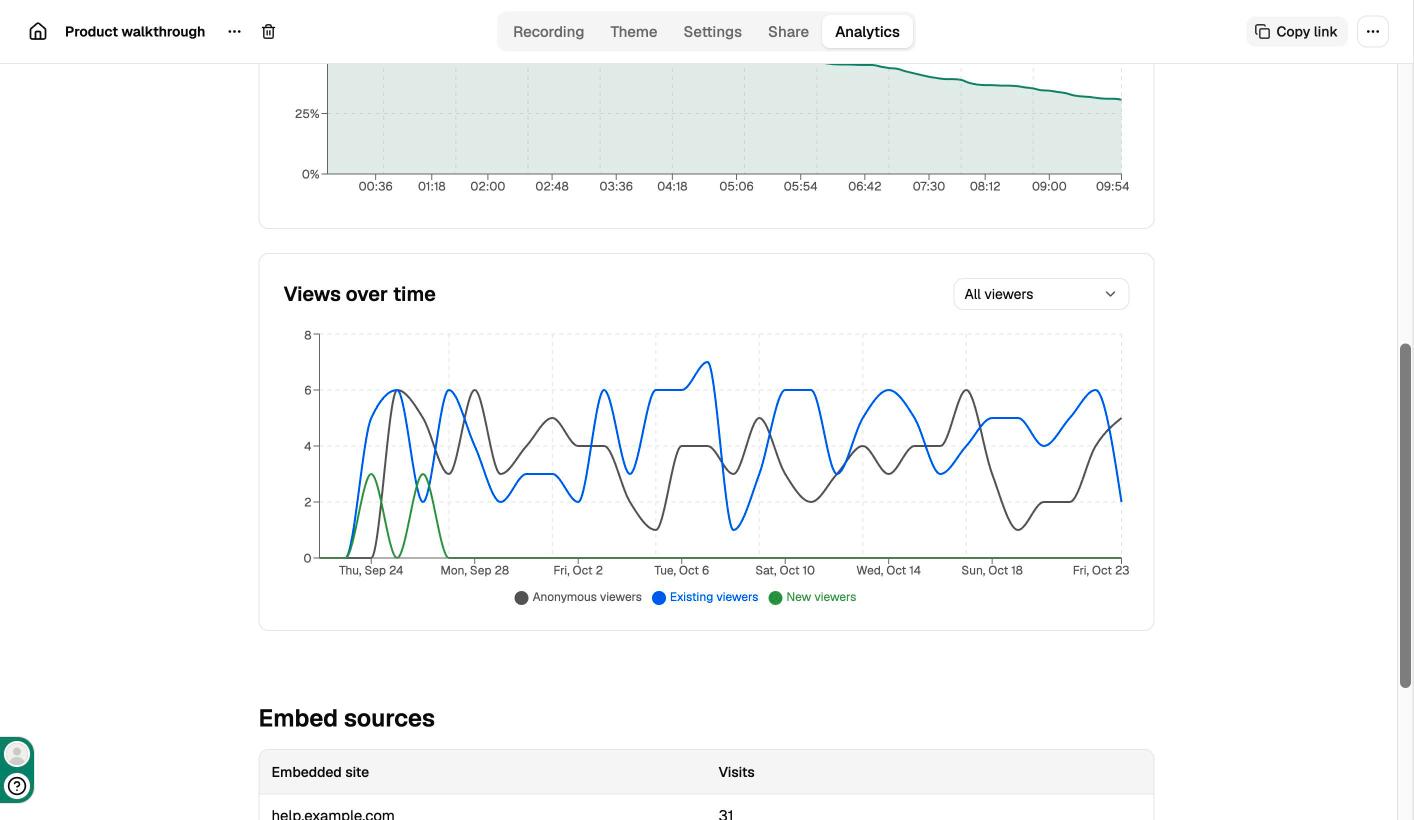
This chart shows the number of views each day, split by the type of viewer. Use the dropdown to show one type at a time.
Anonymous viewers: Viewers who were not signed in to NeetoRecord.
New viewers: Signed-in viewers watching a video from your workspace for the first time.
Existing viewers: Signed-in viewers who had already watched a video from your workspace.
Embed sources
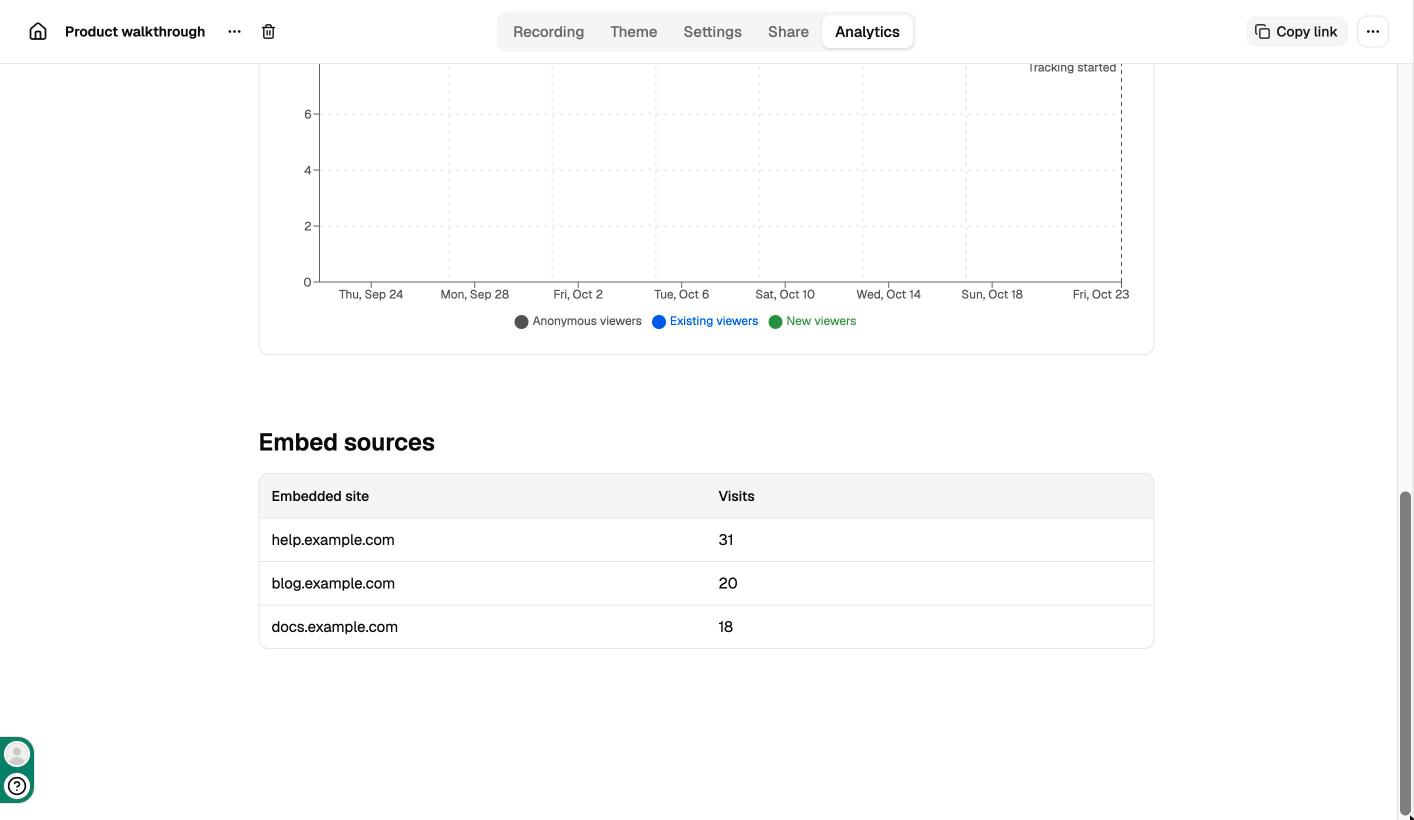
This table lists the sites where the video is embedded, with the number of visits each one received.
Audience
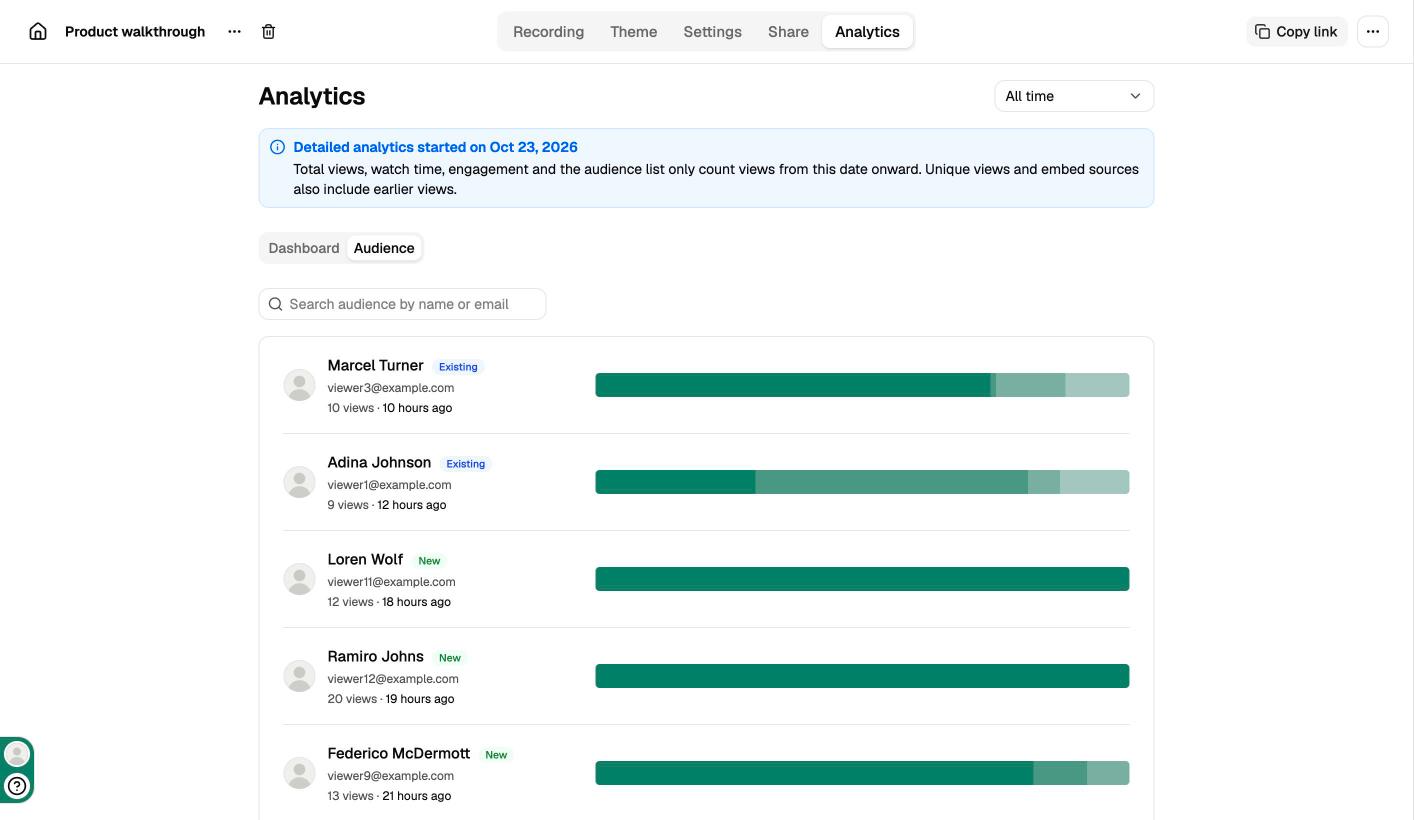
The Audience view lists the signed-in viewers who watched the recording in the selected period, starting with the most recent. You can search for a viewer by name or email. Each row shows:
Viewer type: A New or Existing badge. Hover over it to see when the viewer first watched this video.
Views: How many times the viewer watched the video, and how long ago they last watched it.
Heat strip: A bar that runs the length of the video. Darker sections were played more often. Hover over the strip to see how many times that moment was played.
When detailed analytics started
Detailed analytics started on 26 October 2026. For recordings created before that date, total views, average view duration, engagement, viewer types and the audience list only include views from that date onward. Unique views, visits count and embed sources include earlier views as well.
These recordings show a note at the top of the Analytics tab when the selected period starts before that date, and the Views over time chart marks the start date with a dashed line.